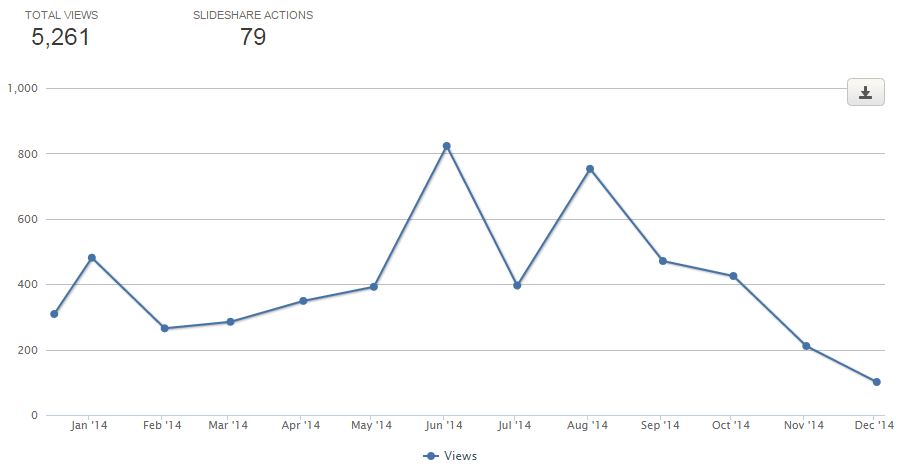
Some cool news from the very awesome slideshare service – Analytics!
Slideshare is extremely powerful! For anyone who regularly creates presentations, webinars, white papers and even articles and listicles, slideshare is an amazing way to expand your reach and archive all your hard work in one central repository.
Even better, Slideshare now offers users some pretty detailed analytics and reporting.
Users can view reports by day, week, month, or year. Diving deeper, reports are available in summary mode, views, action or viewers. Demographic reporting like viewers by region/country are easily accessible as are detailed reporting by slide/content. A handy stat provided is a report of actions by content where you can see the exact number of outbound licks, favorites, comments and downloads – very nice!
If you aren’t using slideshare I highly suggest you look at repurposing some content and presentations here – pretty much anything you have as a PDF can be imported very easily and even more, slideshare can also integrate with your LinkedIn account too!
Want more info, how about this slideshare about the slideshare analytics!
GISuser Editor, Glenn maintains a Slideshare – check it out HERE
Read more about analytics on the Slideshare blog


